HP-02: Learning about ACARS
Preface #
This is the second post in the “Hobby Programming” series. I hoped to get another article out a week after the first one went out, but I have ended up spending more time on this project than I anticipated, but mostly data collection.
Intro #
Over the past few years, I have become super interested in all kinds of radio communications. My interest started off with the RTL-SDR. I could spend hours tuning around various radio bands, just to see what was around. One of the first projects to do with an SDR is tracking planes by receiving ADS-B messages. ADS-B transponders are present on basically all commercial airplanes, and are fairly easy to pick up with an RTL-SDR receiver. What really helps to make these easy to pick up is that planes are typically in the sky, making line of sight pretty easy to achieve. With ADS-B, you can track planes in real time and even get some other info from them including callsign, registration numbers, altitude, speed, and more. It’s all telemetry data, and is only mildly interesting to set up on your own because there are already readily available flight tracking services such as airplanes.live or FlightRadar24.
Another kind of aviation transponder that I hadn’t looked at until recently is ACARS.
What is ACARS #
ACARS is a system used by pilots as well as ground stations for sending short messages via VHF or satellite frequencies. The entry for ACARS on the SigID Wiki was helpful for getting an idea of what frequencies I needed to look on. I had heard that sometimes pilots will send text messages using this system, and I was particularly interesting if I could pick up any notably interesting or humorous messages. Additionally, listening in on ACARS could also give a glimpse into some of the more mundane things that pilots message about. It looked like there are two main “bands” where ACARS communications frequently take place, around 131.000 MHz and another region around 136.750 MHz.
| Frequency | Note |
|---|---|
| 129.125 | USA and Canada Additional |
| 130.025 | USA and Canada Secondary |
| 130.425 | USA Additional |
| 130.450 | USA and Canada Additional |
| 131.125 | USA Additional |
| 131.550 | World Primary |
| 136.700 | USA Additional |
| 136.750 | USA Additional |
| 136.800 | USA Additional |
| 136.850 | SITA North America |
Adapted from frequency chart on SigID Wiki
Interestingly, I saw very little traffic on the 136.750 MHz band, and I did not record any messages on those frequencies. After looking at the amount of traffic on the different frequencies around 131.000 MHz, I decided to record data from the following frequencies:
- 130.025 MHz
- 130.425 MHz
- 130.450 MHz
- 131.125 MHz
- 131.550 MHz
I chose these because it looked like they had the most activity and they fit inside the ~2 MHz bandwidth of my RTL-SDR.
Software setup #
Used acarsdec to decode the ACARS packets. I built it from source on a Raspberry Pi 3B+ running headlessly. Weirdly, I had some trouble connecting to it over SSH. I’m not really sure why this is, but the connection seemed to freeze after a few seconds after connecting to it. Because of that, I mostly used Raspberry Pi Connect to remote into the Pi, which had the benefit of allowing me to connect to it even if I was away from my home network.
Initially I set up acarsdec to record the messages to a log file which it would rotate daily to break it into more manageable chunks. To get these files to a local machine to dig through the data, I set up a Samba share on the Raspberry Pi. The first day of logs was 3.2 MiB in size and mostly full of junk data, or rather data that was junk to me. A huge amount of the data (as I would quantify later) was just automated telemetry and maintenance data. Because I was only really looking for data that was in a text format, I looked for a way to filter out the telemetry data. I found that ACARS messages send a label with them that describes what the data in the message is. Like a fair number of aspects with ACARS data, documentation is not incredibly through or easy to find. Using a couple of sources, primarily this PDF I compiled a list of labels which seemed interesting. I have included the list here,
14, 48, 39, 54, 81, 82, 83, 84, 85, 86, 87, 88, 89, C0, C#, 5Z, B9, 7B
I let the decoder run for about 2 weeks, checking in every couple of days to dig through the logs. The files were fairly large for text data roughly 50 KiB each. It was suboptimal to dig through these in just a text editor, scrolling through the lines and lines of text or searching for potentially common words. Yet still, I will include a couple interesting messages here.
No WiFi
[#1 (F:130.450 L:-10.9 E:0) 17/06/2025 23:00:11.061 --------------------------------
Mode : 2 Label : 5Z Id : 1 Nak
Aircraft reg: N655AW Flight id: US2068
No: M66A
Reassembly: skipped
OS KCLT /FTM
SO. TRUE STORY. THAT
PROCEDURE COMPLETLY
REMOVED THE WIFI. FLIGHT
DECK WIFI NO LONGER
PRESENT

[#1 (F:130.450 L:-16.3 E:0) 17/06/2025 23:08:43.225 --------------------------------
Mode : 2 Label : 5Z Id : 8 Nak
Aircraft reg: N655AW Flight id: US2068
No: M68A
Reassembly: skipped
OS KCLT /FTM
UMMM...LETS SEE...NAW
IT WILL BE ALRIGHT.
THE PAX ARE PROBALLY
WANTING TO LAY SOME
HANDS RIGHT NOW THOUGH
LOL
3 write-ups?
[#2 (F:130.025 L:-29.6 E:0) 24/06/2025 00:21:01.469 --------------------------------
Mode : 2 Label : 5Z Id : 8 Nak
Aircraft reg: N118US Flight id: AA2277
No: M53A
Reassembly: skipped
OS KBNA /FTM
HAD 3 WRITE UPS. IS IT
POSSIBLE TO GET MX TO
VERIFY THE MIC SHEET
NOW....
Need water
[#1 (F:130.450 L:-26.2 E:2) 23/06/2025 10:54:55.367 --------------------------------
Mode : 2 Label : 14 Id : 0 Nak
Aircraft reg: N351FR Flight id: F94601
No: M21A
Reassembly: skipped
1,2,,Y,N,Y,KATL,120618,7716,WILL NEED CATERING,UPON ARRIVAL,PLANE IS NOT STOCKED,MINIMAL WATER,
Retirement flight
[#1 (F:130.450 L:-28.0 E:3) 21/06/2025 17:50:53.015 --------------------------------
Mode : 2 Label : 5Z Id : 8 Nak
Aircraft reg: N762AN Flight id: AA0725
No: M12A
Reassembly: skipped
OS KCLT /FTM
I MEANT TO MENTION THIS
IS MY RETIREMENT FLIGHT
THANK ALL THE DISPATCHER
FOR ALL THE GREAT YEARS
JIM HUNT
A final note for this section, acarsdec is what creates the headers that I have included with the messages.
High time for a database #
It was obviously evident that this method was absolutely unfit for storing and searching the ACARS data. The obvious solution to this problem was to use a database to store the data. That way I could efficiently search through the data, something more elegant than just scrolling through a big text file. I had not sprung to use a database before because I wanted to get something up and running quickly, and I have never used SQL before. But at this point in the project, I decided to use this as a learning experience and dive into SQL.
Luckily, other people have already thought about this and Thierry Leconte has created a program called acarsserv which connects to acarsdec or even vdlm2dec with UDP and stores messages, flights, and ground station info in a sqlite3 database. After building on the raspberry pi remotely, I set up acarsdec to output the messages to a UDP connection and have acarsserv listen and store them.
$ acarsserv -j 127.0.0.1:5555 -b acarsserv.sqlite &
$ acarsdec -o 0 -j 127.0.0.1:5555 -r 0 136.700 136.750 136.800 136.850 &
$ disown -h
I let the server run for approximately 10 days before beginning to dig through the results.
I started by looking up some information on basic SQL usage. Quickly, I was able to filter by labels, count the number of results, and more. I also asked Google’s Gemini for some help with some of the SQL queries.
I started off by just using the sqlite3 command to get an interactive command line to run SQL commands. First I looked at some basic statistics. In total I collected 22,307 messages from 6,952 flights between June 30th and July 10th. One thing I started with was looking at some statistics of what kinds of messages I saw most commonly.
Number of Messages, Sorted by Label
| Label | Messages |
|---|---|
| H1 | 15607 |
| 5Z | 1241 |
| 32 | 887 |
| 21 | 820 |
| 22 | 768 |
| B9 | 562 |
| 16 | 335 |
| 33 | 226 |
| 11 | 202 |
| 37 | 159 |
| 24 | 140 |
| SA | 137 |
| 15 | 132 |
The most popular label I saw was H1, which as I discussed before are messages with miscellaneous telemetry and maintenance data. Those H1 messages made up nearly 70% of all of the messages I collected. Behind H1 in popularity is 5Z, which is generally flight plan information as well as some plain text messages. 32,21, and 22 are all telemetry data. Interestingly, while 21 and 22 both appear to be only used by Frontier airlines for telemetry. Here is a snippet of what some Label 21 messages look like:
POSN 38.071W 77.841, 132,232924,35231,33323,  13,-43,002336,KSYR
POSN 38.656W 77.604, 128,233424,36996,31914,  17,-48,002342,KSYR
POSN 39.007W 77.309, 102,233900,4805,22932,  24, 19,234448,KDCA
POSN 39.249W 77.446, 124,233924,36993,33112,  15,-47,002342,KSYR
POSN 39.180W 77.166, 166,234642,16764,26419,  17,- 2,010048,KATL
POSN 38.749W 76.564, 258,234824,14646,23355,  16,  0,014642,KMIA
POSN 38.641W 77.881, 114,005412,19242,24482,  18,- 8,011718,KBWI
POSN 38.644W 77.270, 112,005912,15112,25116,  21,  0,011748,KBWI
POSN 38.782W 77.269, 302,010406,10454,23777,  19,  7,041054,KDEN
POSN 38.042W 78.581, 146,012842,32327,34838,  11,-37,020400,KPHL
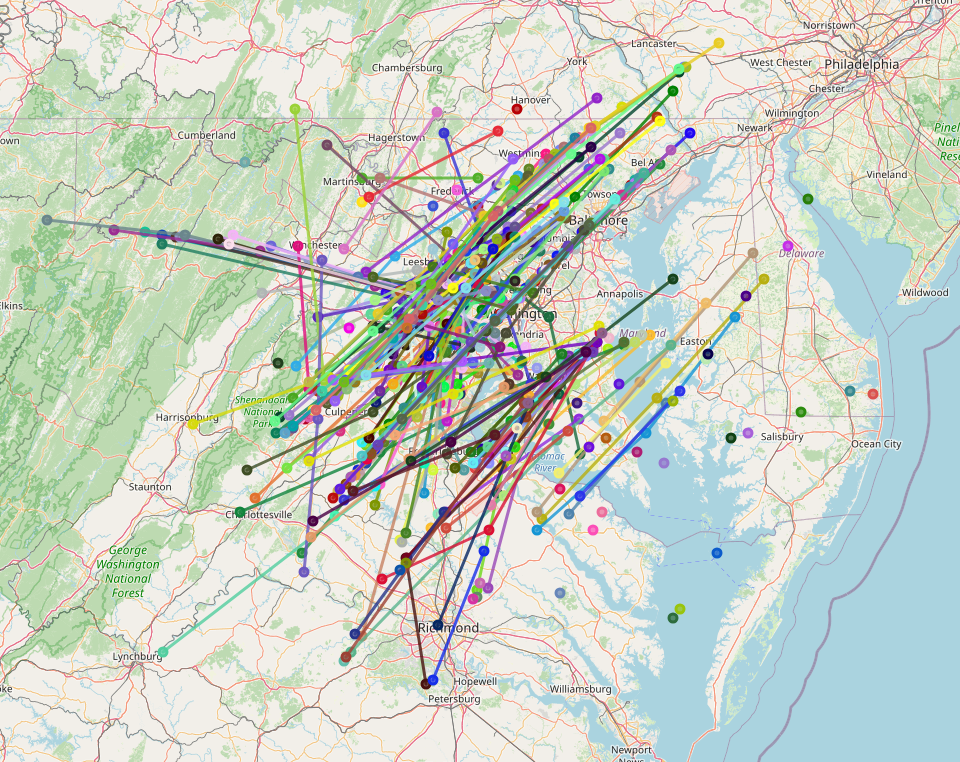
It’s fairly clear that these messages are sending some position data. They all begin with POS, then coordinates marked with N ##.###W ##.###. I thought it would be neat to plot out all of these messages on a map. My first instincts for this would be to turn to python for some quick scripting, but I didn’t know how to chart a map in python or how to communicate with a database. So instead to quickly whip something up I asked Gemini. I gave it a fairly extensive description of what I wanted to do and it quickly wrote up some code.
Unfortunately, I made a mistake when I prompted it. I gave it some sample data so it could see what the messages looked like, but I left in the column with the FlightID, so it got confused. I changed it’s code slightly to get it to work, but other than that it worked perfectly!
import sqlite3
import folium
import random

# --- Helper Function to Convert DMS to Decimal Degrees ---
def dms_to_dd(dms_str, direction):
    """
    Converts a Degrees, Minutes, Seconds (DMS) string (e.g., '380415')
    and a direction ('N', 'S', 'E', 'W') into decimal degrees.
    """
    try:
        # Extract degrees, minutes, and seconds from the 6-digit string
        degrees = int(dms_str[0:2])
        minutes = int(dms_str[2:4])
        seconds = int(dms_str[4:6])

        # Calculate decimal degrees
        decimal_degrees = degrees + (minutes / 60.0) + (seconds / 3600.0)

        # Apply sign based on direction
        if direction in ['S', 'W']:
            decimal_degrees *= -1
        return decimal_degrees
    except ValueError as e:
        print(f"Error parsing DMS string '{dms_str}': {e}")
        return None

# --- Main Function to Plot Flight Paths ---
def plot_flight_paths(db_path="your_database.db"):
    """
    Connects to an SQLite database, extracts flight position messages,
    parses coordinates, and plots flight paths on an interactive map.

    Args:
        db_path (str): The path to your SQLite database file.
    """
    conn = None
    try:
        # 1. Connect to the SQLite database
        conn = sqlite3.connect(db_path)
        cursor = conn.cursor()

        print(f"Connected to database: {db_path}")

        # 2. Query messages with Label = "22"
        # We select FlightID to group paths and Txt to parse coordinates
        cursor.execute("SELECT FlightID, Txt FROM Messages WHERE Label = '22'")
        records = cursor.fetchall()

        # Dictionary to store flight paths: {FlightID: [(lat1, lon1), (lat2, lon2), ...]}
        flight_paths = {}

        print(f"Found {len(records)} messages with Label '22'. Parsing coordinates...")

        # 3. Parse coordinates for each message
        for flight_id, message_txt in records:
            if message_txt[0] in ('N', 'S'):
                lat_dir = message_txt[0] # 'N' or 'S'
                lat_dms = message_txt[2:8] # 6 digits for latitude
                lon_dir = message_txt[8] # 'E' or 'W'
                lon_dms = message_txt[10:17] # 6 digits for longitude

                latitude = dms_to_dd(lat_dms, lat_dir)
                longitude = dms_to_dd(lon_dms, lon_dir)

                if latitude is not None and longitude is not None:
                    # Store coordinates, grouped by FlightID
                    if flight_id not in flight_paths:
                        flight_paths[flight_id] = []
                    flight_paths[flight_id].append((latitude, longitude))
            else:
                # Print a warning for messages that don't match the expected format
                print(f"Warning: Could not parse coordinates from message (FlightID: {flight_id}): '{message_txt[:50]}...' (truncated)")

        if not flight_paths:
            print("No valid flight data with Label '22' found or parsed successfully. Map will not be generated.")
            return

        # 4. Create a base map using Folium
        # We'll center the map on the first coordinate of the first flight found
        first_flight_id = list(flight_paths.keys())[0]
        first_lat, first_lon = flight_paths[first_flight_id][0]
        m = folium.Map(location=[first_lat, first_lon], zoom_start=6)

        # 5. Assign random colors to each unique FlightID
        colors = {}
        for flight_id in flight_paths.keys():
            # Generate a random hex color
            colors[flight_id] = '#%06x' % random.randint(0, 0xFFFFFF)

        # 6. Add flight paths and markers to the map
        print("Adding flight paths to the map...")
        for flight_id, path_coords in flight_paths.items():
            if len(path_coords) > 1:
                # Draw a line for the flight path if there's more than one point
                folium.PolyLine(
                    path_coords,
                    color=colors[flight_id],
                    weight=3, # Line thickness
                    opacity=0.8, # Line transparency
                    tooltip=f"Flight ID: {flight_id}"
                ).add_to(m)

            # Add a marker for each position point
            for i, (lat, lon) in enumerate(path_coords):
                folium.CircleMarker(
                    location=[lat, lon],
                    radius=4, # Size of the marker
                    color=colors[flight_id],
                    fill=True,
                    fill_color=colors[flight_id],
                    fill_opacity=0.7,
                    tooltip=f"Flight ID: {flight_id}, Point {i+1}: ({lat:.4f}, {lon:.4f})"
                ).add_to(m)

        # 7. Save the map to an HTML file
        map_filename = "flight_paths_map.html"
        m.save(map_filename)
        print(f"Interactive map saved to {map_filename}")

    except sqlite3.Error as e:
        print(f"SQLite database error: {e}")
    except Exception as e:
        print(f"An unexpected error occurred: {e}")
    finally:
        # Ensure the database connection is closed
        if conn:
            conn.close()
            print("Database connection closed.")

# --- How to Run This Program ---
if __name__ == "__main__":
    # IMPORTANT: Replace 'your_database.db' with the actual path to your SQLite database file
    # For example: plot_flight_paths("C:/Users/YourUser/Documents/flight_data.db")
    # Or if it's in the same directory as this script: plot_flight_paths("my_flights.db")
    plot_flight_paths("../../acarsserv.sqlite")
And when I ran the code I got out an HTML file with a beautiful map!
And after changing the code to work with the label 22 messages, which only differ slightly, I got another very similar looking map.
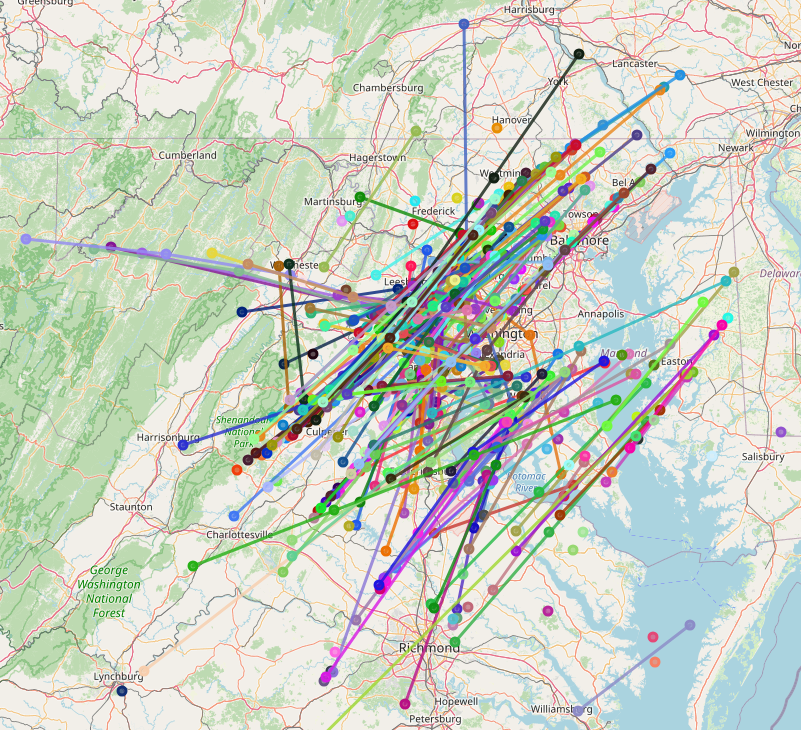
This surprised me, so I double checked my code to make sure I was actually changed the SQL query, but it really was different. It turns out that both kinds of messages are sending the same data, just in different formats! I suspect that this is for redundancy, but I don’t really know.
I was surprised at how well Gemini was able to get 99% of the way there on this complicated query. However, when I tried to have it change things about the code, or fix the issue I initially created for it, it was stubborn and would seemingly randomly change other aspects of the code. While it gave me an incredible head start, it was unhelpful for editing it’s code, and I had to make any changes that I wanted manually.
That is about as far as I have gotten in processing and analysing the data, but I expect to put out a future update, looking at more text messages and maybe other data messages. This step has taken a lot longer than I wanted, but most of the time allowed for lots of data collection. Beyond the data I have already collected, it could also be interesting to look into satcom ACARS and VDLM2 (I have even already collected some VDLM2 data, so be on the lookout for that!)